Administrative Burden Statistics 2026: Time Lost to Admin
TL;DR
Administrative burden statistics for 2026 show professionals lose hours weekly to paperwork in healthcare, teaching and business. A 2016 study: doctors spent 49.2% of the day on EHR and desk work, almost twice the 27% spent with patients (Annals of Internal Medicine). This post collects 15 statistics on administrative burden. Speakwise records conversations and writes the summary and action items.


Used by recruiters, executives, consultants, and more.
Administrative Burden Statistics 2026: Time Lost to Admin
Administrative burden statistics for 2026 show that paperwork and documentation eat into work time for physicians, teachers, small business owners and office workers. In a 2016 study of 57 physicians in four specialties, published in the Annals of Internal Medicine, doctors spent 49.2% of the office day on EHR and desk work, compared with 27% in direct contact with patients. US public school teachers reported working 53 hours a week in a 2024 RAND survey, 9 more than comparable working adults, and ranked admin work among their top three stress factors. The federal government's own estimate puts the paperwork burden on the American public at 10.503 billion hours in fiscal year 2023. Microbusiness owners surveyed by UENI in May 2024 report spending 22.4% of their time on admin, legal and compliance work.
Administrative burden is not a vague complaint about busywork. Political scientists Pamela Herd and Donald Moynihan use the term for something specific: the learning, compliance and psychological costs people face when they deal with government, such as benefit applications, tax forms and public services. This post uses the phrase more loosely, to include paperwork and documentation at work.
This post collects 15 statistics on administrative burden in healthcare, teaching, government, small business and general office work. It is for anyone who wants real numbers behind the feeling that paperwork is eating the workday, not just one profession's complaint. Each statistic links to the study, survey or government report it comes from.
Key Administrative Burden Statistics (2026)
- Administrative burden is clearest in medicine: a 2016 study of 57 physicians found they spent 49.2% of office hours on EHR and desk work, versus 27% in face time with patients (a 2016 Annals of Internal Medicine study).
- In an AMA survey of 1,000 physicians in late 2024, physicians and their staff spent about 13 hours a week on prior authorization paperwork (American Medical Association).
- The federal government's own estimate puts the paperwork burden on Americans at 10.503 billion hours in fiscal year 2023 (Office of Management and Budget).
- US public school teachers reported working 53 hours a week in RAND's 2024 survey, 9 more than comparable working adults, and put admin work among their top three stress factors (RAND's 2024 State of the American Teacher survey).
- US lower secondary principals spent 27% of their time on administrative tasks and meetings in 2018, about the same as the 28% TALIS average (National Center for Education Statistics, TALIS 2018).
- US microbusiness owners (five or fewer employees) said in a May 2024 UENI survey that they spend 22.4% of their time on admin, legal and compliance work (UENI).
- In Smartsheet's June 2017 survey, more than 40% of US information workers said they spend at least a quarter of their work week on manual, repetitive tasks like data entry (Smartsheet).
1. Physicians spent 49.2% of the office day on EHR and desk work, versus 27% in face time with patients
49.2% of the average office day goes to electronic health records and desk work for US physicians. Researchers watched 57 doctors for 430 hours across family medicine, internal medicine, cardiology and orthopedics. During office hours, those same doctors spent 27% of their time in direct contact with patients and 49.2% on EHR and desk work: notes, orders, inbox messages and other work tied to the record system. The rest went to administrative tasks and other tasks.
The study was published in 2016 and covered four specialties. For a doctor who sees patients all day, the actual record shows something different: a job split between the exam room and the screen, with the screen taking the largest share of the time. That split is a clear picture of how much paperwork follows physicians through the day, and it is the starting point for the rest of the numbers in this post.
Source: PubMed: Allocation of Physician Time in Ambulatory Practice, Sinsky et al. 2016
2. Inside the exam room, physicians still spend 37% of their time on the EHR
37% is how much time physicians spent on the EHR and desk work even while they were inside the exam room with a patient. The same time and motion study tracked 57 doctors face to face with patients, not just across the office day overall. In that setting, 52.9% of physician time went to direct clinical face time.
But more than a third still went to the screen: typing notes, reviewing results, or placing orders while the patient waited. The exam room is supposed to be the one place fully reserved for the patient. Even there, documentation work claims more than a third of the clock. It is a clear sign that administrative burden in medicine does not stay in the back office. It follows physicians into the room.
Source: PubMed: Allocation of Physician Time in Ambulatory Practice, Sinsky et al. 2016
3. Practices complete 39 prior authorizations per physician a week, costing 13 hours
39 prior authorization requests per physician, per week: that is the average load an AMA survey of 1,000 physicians found in late 2024. A prior authorization is a health plan's approval, required before it will pay for a test, a drug or a procedure. Getting that approval takes work, and the same survey put the cost at 13 hours a week of combined physician and staff time, about a day and a half of work.
That time goes to phone calls, fax forms, portals and appeals, on top of actually treating the patient. Multiply 13 hours by a year, and prior authorization alone can account for hundreds of hours of a practice's time that never touches patient care. It is a clear example of paperwork that sits between a doctor and a decision an insurer has already made, and it shows why administrative burden is as much about outside requirements as it is about a clinic's own records.
Source: AMA: Fixing Prior Auth, Nearly 40 Prior Authorizations a Week Is Way Too Many
4. Automating healthcare paperwork could save $20 billion more, on top of $222 billion already saved
$20 billion a year: that is the additional savings the 2024 CAQH Index says the medical and dental industries could capture by moving remaining manual tasks, such as phone, mail, fax and email, to electronic systems. CAQH tracks how health plans and providers handle routine transactions like eligibility checks, claims and payments, drawing on data from more than 600 provider organizations and from health plans that cover 63% of insured Americans.
The same report found that automation already helped the industry avoid spending $222 billion on these tasks, a 15% jump from the year before. Together, the numbers show two things at once: automation is working, and a large slice of health care's paperwork still is not automated. Every dollar spent on manual administrative work is a dollar that does not go to care.
Source: CAQH: 2024 CAQH Index Report
5. US lower secondary principals spent 27% of their time on administrative tasks and meetings in 2018
27% of a US lower secondary principal's time goes to administrative tasks and meetings, more than any other task on the job. That number comes from the OECD's 2018 Teaching and Learning International Survey (TALIS), compiled by the National Center for Education Statistics. It sits close to the 28% average across every TALIS education system, so American principals are not an outlier.
By comparison, principals spent 18% of their time on leadership tasks and meetings and 18% on direct interaction with students. Administrative work topped every other category by itself. A principal's job is often described as instructional leadership, but the time data tells a plainer story: more than a quarter of the week goes to paperwork and scheduled meetings, not to classrooms or staff.
Source: National Center for Education Statistics: TALIS 2018 Results
6. US lower secondary teachers spend 28 of their 46-hour work week teaching
28 of 46 hours: that is how US lower secondary teachers split their work week between actual teaching and everything else, according to the same 2018 OECD survey. Teaching made up well over half the week, and the survey does not break down exactly how the other 18 hours were spent.
US teachers taught more hours than their peers in all but two of the education systems TALIS covers, and they logged more total working hours than teachers in 40 of the other 48 systems surveyed. The pattern suggests American teachers are teaching longer than teachers almost anywhere else. It does not show they carry a heavier load of paperwork than teachers elsewhere.
Source: National Center for Education Statistics: TALIS 2018 Results
7. 30% of US lower secondary teachers say administrative work causes them quite a bit or a lot of stress
The same 2018 OECD survey asked teachers how much stress each of 11 listed items caused them. Too much grading (36%) and being held responsible for student achievement (35%) came first. Keeping up with changing requirements from education authorities and maintaining classroom discipline followed at 32% each.
Too much administrative work came in close behind at 30%, just ahead of too much lesson preparation at 29%. Administrative work is not the single biggest source of stress in the data. It ranks fifth of the 11 sources, close to discipline and compliance demands.
Source: National Center for Education Statistics: TALIS 2018 Results
8. US public school teachers reported working 53 hours a week in 2024, 9 more than comparable working adults
53 hours a week: that is the average workload K-12 public school teachers reported in RAND's 2024 State of the American Teacher survey of 1,479 teachers. Comparable working adults reported working 44 hours a week in the same survey, 9 hours less. The survey lists administrative work outside of teaching, such as paperwork and teacher evaluation, among the top three sources of stress for 33% of teachers, after managing student behavior (45%) and low pay (37%).
The gap between 53 and 44 hours is nearly two extra hours a day in a five-day work week, RAND notes. Teachers ranked managing student behavior as their top source of stress even more often than administrative work, so the classroom itself is part of the story too.
Source: RAND: Teacher Well-Being and Intentions to Leave in 2024
9. The federal paperwork burden on Americans hit 10.503 billion hours in 2023
10.503 billion hours: that is the federal government's own estimate of the paperwork burden on the American public in fiscal year 2023, from the White House's Information Collection Budget. The number rose from 10.343 billion hours the year before, a change of 159 million hours.
Every year, by law, the Office of Management and Budget has to report this figure to Congress under the Paperwork Reduction Act. It covers every form, survey and report the public has to fill out for a federal agency, from tax filings to benefit applications to safety reports. The Biden White House called its effort to cut this number "Tackling the Time Tax," a label that captures what these hours really are: time taken directly from people's lives before they get what they came for.
Source: Office of Management and Budget: Tackling the Time Tax, FY 2023 Information Collection Budget
10. The Treasury Department, mostly IRS tax forms, drives about 63% of that burden
About 63% of the entire federal paperwork burden traces back to one department: Treasury, which includes the IRS. The same fiscal year 2023 Information Collection Budget breaks the 10.503 billion hour total down by agency, and Treasury alone accounts for 6,657.1 million of those hours, far more than any other department.
The report shows that most of Treasury's 53.8 million hour change in 2023 came from adjustments to its burden estimates (49.0 million hours), not from new rules. In other words, the bulk of the country's paperwork burden is not about new regulations. It is the repeated cost of filing taxes.
Source: Office of Management and Budget: Tackling the Time Tax, FY 2023 Information Collection Budget
11. SNAP reached 88% of eligible people in 2022, the highest rate on record
88% of people eligible for SNAP, the federal food benefit program known as food stamps, actually received it in fiscal year 2022, according to the US Department of Agriculture's own participation rate estimates. That is the highest rate in the nearly 50 year history of the data series, but it still means about 12%, or roughly one in eight eligible people, did not get benefits they qualified for that year.
USDA does not say why some eligible people miss out on benefits. The 12% gap shows a real shortfall between who qualifies for SNAP and who actually receives it, not a specific measure of paperwork or any single cause.
Source: USDA Food and Nutrition Administration: Trends in USDA SNAP Participation Rates, FY 2020 and 2022
12. US microbusiness owners spend 22.4% of their time on admin, legal and compliance work
22.4% of a microbusiness owner's time goes to administrative tasks, legal work and compliance, which UENI says includes managing staff, finances, scheduling and inventory. UENI, a company that builds websites for small businesses, ran its own survey of 837 US businesses with five or fewer employees in May 2024. The same owners reported working a median of 60 hours a week, 20 hours more than a standard full time job.
Nearly a quarter of the work week on admin, legal and compliance work means the median 60-hour week includes about 13 hours of it, time that does not go to a single new customer. For the smallest businesses, that time has no backup. If the owner is filling out forms, nobody else is serving customers or closing sales.
Source: UENI: How Microbusiness Owners Spend Their Time
13. Microbusiness owners spend 79% more time on admin, legal and compliance work than on marketing and sales
79% more time: that is how much more US microbusiness owners spend on admin, legal and compliance work than they spend on marketing and sales, in the same 2024 UENI survey. Marketing and sales are the activities that bring in new revenue. Admin and compliance keep the business legal and organized, but do not grow it.
The gap between the two shows where the hours actually go when an owner sits down to work, and it is not toward growth. The same survey found owners spend 11.2% of their time on professional development, half of what goes to admin, legal and compliance work. For a business trying to grow, that balance of time runs backward: upkeep beats growth by a wide margin.
Source: UENI: How Microbusiness Owners Spend Their Time
14. In 2017, more than 40% of US information workers spent at least a quarter of their week on repetitive tasks
Over 40% of office workers said they spend at least a quarter of their work week on manual, repetitive tasks, with email, data collection and data entry taking up the most time. That is roughly a full workday a week. The figure comes from Smartsheet's own 2017 survey of about 1,000 US information workers, fielded by the research firm Market Cube, and it is the same survey Smartsheet's website still cites today.
None of this is complex work. It is the kind of task that exists because information has to move from one system, or one person, to another, by hand. The pattern cuts across office jobs broadly, not just one profession or industry. A quarter of the work week is a large chunk of time to spend on tasks that add no new ideas or decisions, just the movement and re-entry of information that often already exists somewhere else. Treat the exact share as dated: the underlying survey is almost a decade old, even though it is still presented as a current figure.
Source: Smartsheet: Automation in the Workplace 2017
15. In 2017, almost 60% of US information workers said automation could save them 6 or more hours a week
Nearly 60% of workers in the same 2017 Smartsheet survey of about 1,000 US information workers estimated that automation could save them six or more hours a week. That estimate lines up neatly with the quarter of a work week workers already said goes to manual, repetitive tasks.
Six hours is not a trivial number. Over a year, it adds up to more than seven standard workweeks per employee, time currently spent moving data by hand instead of doing work that needs a person's judgment. The gap between what workers do now and what they believe is possible is itself a measure of administrative burden: hours lost not because the work is hard, but because nobody has automated it yet. Treat this number as a dated snapshot too, from years before many of today's automation tools existed.
Source: Smartsheet: Automation in the Workplace 2017
What Administrative Burden Statistics Add Up To
These numbers come from different fields, but they point to the same pattern. Whether it is a physician, a teacher, a small business owner or an office worker, a meaningful slice of every workday goes to tasks that do not directly serve a patient, a student, a customer or an idea. In health care and small business, that slice is close to a quarter of the time or more. In government, the hours are so large they are measured in billions, not percentages.
Administrative work is one stress factor among several, not the only one. Teachers put it in their top three sources of stress at 33% in RAND's 2024 survey, behind managing student behavior (45%) and low pay (37%). Our employee burnout statistics roundup shows a similar pattern across the wider workforce: paperwork is one of several things that wear workers down, not the single cause.
None of this means paperwork and documentation are pointless. Records protect patients, compliance protects the public, and some administrative work is simply unavoidable. The real issue is how much of it is manual, repeated and could move to a tool instead of a person. Every statistic in this post that measures what automation could save points the same way: toward less time spent proving work happened, and more time spent doing it.
Administrative burden is not one profession's problem. It shows up as a tax on time in healthcare, education, government and small business alike.
Let Speakwise Handle the Write-Up
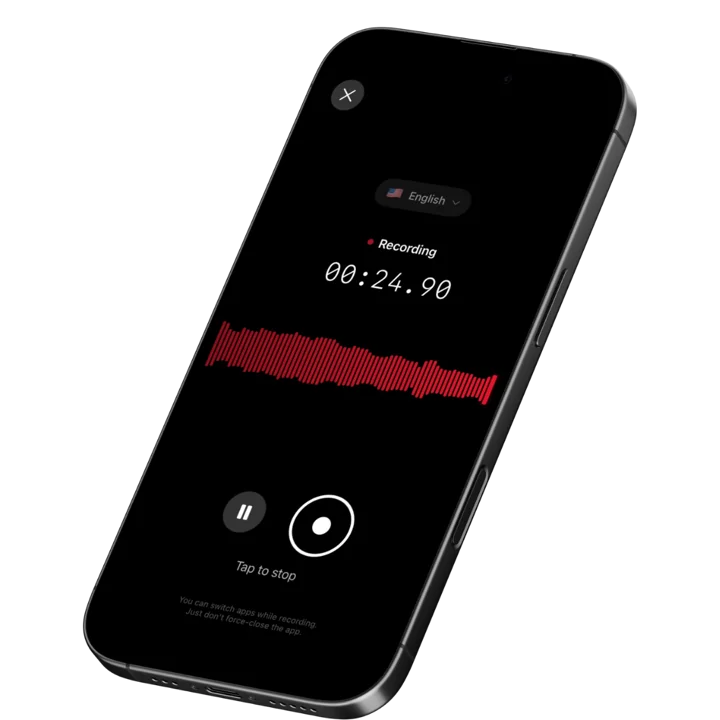
Some of the administrative work in this post is a write-up job: someone turning a conversation or a visit into a written record after the fact. A physician's desk work, a teacher's reporting and a consultant's recap can all start this way. Speakwise helps with that part. It records an in-person conversation, meeting, lecture or interview with one tap, then turns it into a transcript, an AI summary and action items. Users report saving about 73% of their post-meeting follow-up time (Speakwise user surveys).
The app's summary templates fit more than one kind of administrative work, including a clinical session note, a lecture and study note, and a site and inspection report, each with an adjustable level of detail. That matters for fields built on documentation, from the nurses and clinicians who chart after every shift to social workers whose casework depends on accurate, timely notes. Speakwise reaches 95%+ accuracy in optimal audio conditions and 92%+ in noisy rooms with several speakers, works in 100+ languages, and keeps recording for up to 5 hours per recording, even offline.
Start with a 7-day free trial ($0.00). After that, Speakwise costs from $69.99 per year, which is about $5.83 a month, billed yearly. Prices shown are for the US and can differ by country.Download Speakwise from the App Store and let it write up what already happened.
Try Speakwise free for 7 days
Available on the App Store | iOS Optimized

🎯 4.9★ App Store Rating | 📱 Built for iOS
