Workplace Communication Statistics 2026: Costs and Data
TL;DR
Workplace communication statistics for 2026 show a 2022 estimate that poor communication could cost US firms as much as $1.2 trillion a year. Leaders estimate their teams lose 7.47 hours a week to it (Grammarly and Harris Poll). This post collects 25 sourced statistics on workplace communication. Speakwise turns those conversations into a transcript and summary you can read later.
Used by recruiters, executives, consultants, and more.
Workplace Communication Statistics 2026: Costs and Data
Workplace communication statistics for 2026 show a 2022 Grammarly and Harris Poll estimate that poor communication could cost US businesses up to $1.2 trillion a year, or about $12,506 per employee. Business leaders in that same survey say their teams lose 7.47 hours a week to it, almost a full workday. The average Microsoft 365 user gets 117 emails a day and 153 Teams messages per weekday, in Microsoft data through February 2025. An Owl Labs survey of 2,000 full-time US workers found 38% were hybrid or remote in July 2024, up from 33% in 2023. This post covers 25 sourced statistics on the cost, tools and future of workplace communication.
Work used to mean a desk, a phone and a handful of scheduled meetings. Now it means email, chat, video calls and AI tools layered on top of each other, often at the same time. Researchers at Microsoft, Slack, Gallup, Owl Labs, Buffer and Grammarly have each measured a piece of this shift.
This post collects 25 statistics on workplace communication from 2015 to 2025, grouped by theme: the cost of poor communication, email, chat and messaging, meetings, remote and hybrid work, listening, generations and AI. It is for managers, HR teams and anyone who wants sourced numbers instead of guesses about how people actually communicate at work.
Key Workplace Communication Statistics (2026)
- Workplace communication statistics include a 2022 estimate that poor communication could cost US businesses up to $1.2 trillion a year (Grammarly and Harris Poll).
- Business leaders say their teams lose 7.47 hours a week to poor communication, almost a full workday, in the same 2022 survey (Grammarly and Harris Poll).
- The average Microsoft 365 user gets 117 emails a day, most skimmed in under a minute, in Microsoft data through February 2025 (Microsoft WorkLab).
- 38% of full-time US workers in Owl Labs' own survey were hybrid or remote in 2024, up from 33% in 2023 (Owl Labs).
- Just 7% of desk workers called AI outputs completely trustworthy for work tasks in Slack's 2024 Workforce Index (Slack Workforce Index).
- Employees who often miss important work messages are 52% less likely to be engaged at work, in a 2022 study (Axios and Gallup).
- 86% of knowledge workers say they experience communication issues at work, in the same 2022 survey (Grammarly and Harris Poll).
The Cost of Poor Communication
Poor communication is not just annoying. Researchers have put a price on it, in dollars, hours and lost trust.
1. A 2022 estimate says poor communication could cost US businesses up to $1.2 trillion a year
Up to $1.2 trillion is Grammarly and the Harris Poll's 2022 estimate for the yearly cost of ineffective communication to businesses in the United States. Researchers built this number by multiplying an estimated $12,506 per employee per year by about 100 million US knowledge workers. The $12,506 figure comes from business leaders' own estimate of 7.47 hours of work lost each week to poor communication, multiplied by an average team salary of $66,967.
The survey covered 1,252 business leaders and knowledge workers in the US. This is an estimate built from self-reported time loss, not a measured accounting figure, so treat it as a rough size, not an exact bill. Even as a rough estimate, it shows that communication problems carry a real cost, not just a vague feeling of friction.
Source: Grammarly and Harris Poll: The State of Business Communication
2. 89% of business leaders say poor communication hurt their business
89% of business leaders in the same 2022 Grammarly and Harris Poll survey said they had experienced an adverse impact from poor communication at work. The top effects were increased costs, named by 45% of leaders, missed deadlines or a longer time to resolve problems, named by 39%, and eroded brand credibility or reputation, named by 34%.
These are not small, vague complaints: leaders named higher costs, missed deadlines and damage to their brand as real effects on their business. When close to 9 in 10 leaders report this kind of damage, poor communication looks less like an occasional bad day and more like a routine business risk. Our workplace communication breakdown statistics cover more of the ways these breakdowns show up day to day.
Source: Grammarly and Harris Poll: The State of Business Communication
3. Business leaders say their teams lose 7.47 hours a week to poor communication
7.47 hours a week, almost one full workday, is what business leaders estimate their teams lose to poor communication, according to a 2022 survey by Grammarly and the Harris Poll. That works out to about 19% of a standard 40-hour workweek.
This number is the base for the $12,506-per-employee cost estimate above. It is a leader's estimate, not a stopwatch measurement, so individual teams will vary. Still, the size of the number matters. Losing close to a fifth of the workweek to miscommunication leaves far less time for the actual work. It also helps explain why so many knowledge workers, in the same study, say they experience communication issues of their own at work, a gap covered in the next statistic.
Source: Grammarly and Harris Poll: The State of Business Communication
4. 86% of knowledge workers experience communication issues at work
86% of knowledge workers say they experience some kind of communication challenge at work, according to a 2022 survey by Grammarly and the Harris Poll. Among knowledge workers who spend half their workweek communicating, the top challenges were not receiving timely responses from others, named by 49%, communicating clearly enough for the other person to understand, named by 37%, and understanding the messages they received, named by 33%.
Those three problems point in different directions: too slow, unclear when sending, and unclear when receiving. That spread suggests there is no single fix. A team cannot solve slow replies and unclear writing with the same change. It also matches a related finding in the same survey: almost 3 in 4 business leaders (72%) and half of knowledge workers (50%) agreed their team struggled to communicate effectively over the past year. Our communication skills gap statistics look at this problem from the training side.
Source: Grammarly and Harris Poll: The State of Business Communication
5. Only 20% of employees strongly agree their company's leaders communicate effectively
Only 20% of employees strongly agree with the statement "the leadership of my organization communicates effectively with the rest of the organization," according to a 2022 Axios and Gallup survey summary published by Axios HQ, which does not give a sample size. The other 80% either disagreed or stopped short of strongly agreeing.
A gap this wide between leaders and the rest of the organization is not a small detail. Employees rely on leadership communication to understand priorities, changes and why decisions get made. When only 1 in 5 employees strongly agree that leaders communicate effectively, the other 4 in 5 are less sure that the message lands. Our leadership communication statistics dig deeper into how leaders specifically fall short, and what changes the picture.
Source: Axios and Gallup: Communications Study
Written messages still dominate the workday. Here is how much of it email alone takes up.
6. Knowledge workers spend 5.3 hours a week on email alone
5.3 hours a week is how much time knowledge workers spend on email, more than any other communication channel, according to a 2022 survey by Grammarly and the Harris Poll. Virtual video meetings came second at 4.03 hours, and text-based chat third at 3.35 hours. Email was also the most preferred channel: 57% of knowledge workers said they prefer it. People could pick more than one preferred channel, so the shares for all channels add up to more than 100%.
Email is part of a bigger written-communication load. The same survey found knowledge workers spend about 20 hours a week, roughly half of a 40-hour workweek, on written communication of all kinds: writing new messages, responding to others and creating documents. Email on its own takes up more than a quarter of that total. Our email overload statistics look at what happens as that inbox keeps growing.
Source: Grammarly and Harris Poll: The State of Business Communication
7. The average Microsoft 365 user gets 117 emails a day
117 emails a day is what the average Microsoft 365 user receives, according to Microsoft's 2025 Work Trend Index special report on what it calls the "infinite workday." The data runs through February 2025 and excludes education and EU customers. Most of those emails are skimmed in under 60 seconds, which means the inbox works more like a stream to triage quickly than a place for careful reading.
Microsoft built this figure from anonymized, aggregated signals across Microsoft 365, not a survey of opinions. It reflects what people actually received, not what they recalled afterward. A 117-email day leaves little room for each message to get real attention. That volume is one reason short, scannable writing and AI-generated summaries have become more valuable. There simply is not time to read everything in full.
Source: Microsoft WorkLab: Breaking Down the Infinite Workday
8. People read about four emails for every one they send
Four to one is the ratio Microsoft's 2024 Work Trend Index found between emails read and emails sent. The typical person reads about four emails for every one they write. Reading, not writing, is where most email time goes.
This ratio helps explain why email eats hours of the week even for people who are not spending much of that time composing new messages. Most of the hours go to opening, scanning and deciding what to do with messages other people sent. It also means tools that cut reading time, such as summaries, previews or AI digests, have more room to save time than tools that only speed up writing.
Source: Microsoft WorkLab: AI Data Drop, 3 Key Insights From Real World Research on AI Usage
Chat and Messaging
Chat apps were supposed to replace long email threads. Instead, most people now juggle both.
9. The average Microsoft 365 user gets 153 Teams messages every weekday
153 Teams messages per weekday is the average Microsoft reports for people who use Microsoft 365, on top of the 117 emails in the same report. Combined, that is about 270 incoming items on a workday across just these two channels, before counting other chat apps.
Chat was built to be faster and more casual than email, but high volume brings its own kind of noise. A message that takes 10 seconds to read is still a message, and 153 of them adds up to a lot of small interruptions across a workday. Our Slack messaging statistics look at what this kind of volume does to focus and response times on another popular chat platform.
Source: Microsoft WorkLab: Breaking Down the Infinite Workday
10. Knowledge workers spend 3.35 hours a week in text-based chat
3.35 hours a week is how much time knowledge workers report spending in text-based chat, according to a 2022 survey by Grammarly and the Harris Poll. That is less than email (5.3 hours) or video meetings (4.03 hours), but still a meaningful slice of a 40-hour week spent typing short messages back and forth.
Chat's lower hour count does not make it a minor channel. It is often used for quick, time-sensitive questions that interrupt deeper work, even if the total minutes are smaller than email. Only 29% of knowledge workers said they prefer chat, well behind email (57%) and video meetings (40%). People could choose more than one preferred channel, but chat still trailed far behind.
Source: Grammarly and Harris Poll: The State of Business Communication
11. 61% of knowledge workers prefer real-time communication over async
61% of knowledge workers say they prefer real-time communication, and 55% say they communicate synchronously most of the time, according to a 2022 survey by Grammarly and the Harris Poll. That is a clear majority choosing live back and forth over messages that wait for a reply.
This preference sits in tension with the volume numbers above. Real-time channels like chat and video meetings are also the ones most likely to interrupt focused work, since they expect a quick response. Teams that want fewer interruptions often have to actively choose asynchronous habits, such as writing one fuller message instead of starting a live thread, rather than defaulting to what most people say they prefer. Our asynchronous communication statistics look at what happens when teams make that switch.
Source: Grammarly and Harris Poll: The State of Business Communication
12. 70% of employees want shorter communications at work
70% of employees say they prefer shorter digital communications over longer ones, according to a 2022 Axios and Gallup communications study. Only 4% said they prefer longer items, and 26% had no strong preference either way.
This finding cuts across channels. It is not only about email or only about chat, but a general appetite for messages that get to the point quickly. Combined with the email and chat volumes above, the picture is consistent: people get a high number of messages and would rather each one take less time to read. Writing shorter does not mean saying less. It means cutting the parts a reader has to work through to find the point.
Source: Axios and Gallup: Communications Study
Meetings
Meetings are where written channels give way to live conversation, and they come with their own time cost.
13. Knowledge workers spend 4.03 hours a week in video meetings, business leaders 5.82
4.03 hours a week is how much time knowledge workers spend in virtual video meetings, according to a 2022 survey by Grammarly and the Harris Poll. Business leaders spend more: 5.82 hours a week, the most of any channel the survey lists for leaders.
The gap between leaders and knowledge workers shows up across almost every channel in this survey, and meetings are no exception. Leaders spend over 36 hours a week on communication in total, compared with over 26 hours for knowledge workers. Our time spent in meetings statistics break down meeting time in more detail.
Source: Grammarly and Harris Poll: The State of Business Communication
14. Business leaders spend almost twice as much time in in-person meetings as knowledge workers
5.23 hours a week is how much time business leaders spend in in-person meetings, compared with 2.96 hours for knowledge workers, according to a 2022 survey by Grammarly and the Harris Poll. That is almost double.
In-person meetings tend to cluster around the people who set strategy and make decisions, which fits with leaders spending more of their time this way. For knowledge workers, the lower number suggests most of their meeting time goes to virtual video calls instead (4.03 hours a week) rather than walking into a room. Project or sales management software was business leaders' third most-used channel, at 5.06 hours a week, close behind their in-person meeting time. The mix of channels, not just the total hours, differs by role.
Source: Grammarly and Harris Poll: The State of Business Communication
15. People using Microsoft's Copilot at one consulting firm spent 16% less time in meetings
16% less time in meetings is what people using AI at one consulting firm spent, according to Microsoft's own WorkLab study of its Copilot product, published in September 2024. The study tracked 6,317 employees across 58 Microsoft 365 Copilot customers over nine months using real usage data, not self-reports.
Microsoft said AI began to reduce the time spent exchanging information in meetings. At a separate energy company in the same study, the number of meetings left early rose 12%, which Microsoft said suggests people may feel comfortable bowing out because they can use Copilot to get meeting notes, ask questions and check on action items.
Source: Microsoft WorkLab: AI Data Drop, 3 Key Insights From Real World Research on AI Usage
Remote and Hybrid Work
Where people work changes how they communicate, and the mix of remote, hybrid and office work is still shifting.
16. In Owl Labs' own survey, 38% of full-time US workers were hybrid or remote in 2024, up from 33% in 2023
38% of US workers were hybrid or fully remote in 2024, up from 33% in 2023, according to Owl Labs' State of Hybrid Work 2024 report, based on its own survey of 2,000 full-time US workers. Full-time office work fell to 62% of the workforce, down from 66% in 2023.
Inside that 38%, hybrid work reached 27% of workers, up from 26% in 2023, and fully remote work reached 11%, up from 7% in 2023. Each arrangement changes which communication channels matter most. A fully remote worker cannot lean on hallway conversations, so email, chat and video calls carry more of the load by default. Our remote work communication statistics cover how remote teams adapt their channels.
Source: Owl Labs: State of Hybrid Work 2024
17. 67% of remote workers who prefer being on camera say it is because they can see expressions
Among the 62% of remote workers who prefer to be on camera during video calls, 67% say the reason is that it is easier to communicate when they can see someone's expression, according to Buffer's State of Remote Work 2023 report, a survey of about 3,000 remote workers around the world run in fall 2022.
Being able to see a face still matters even in a world of chat and email. A raised eyebrow or a smile on screen can fill in context that a written message cannot carry. The tradeoff is that video calls need everyone online at the same time, unlike a written message that can wait for a reply.
Source: Buffer: State of Remote Work 2023
18. 75% of remote workers feel connected to their colleagues
75% of remote workers say they feel connected to their colleagues or clients, according to Buffer's State of Remote Work 2023 report, a fall 2022 survey of about 3,000 remote workers around the world (19% in the US, many in software and IT). Only 17% said they do not feel connected, and among that smaller group, the most common reason, given by 56%, was a lack of opportunity to connect socially.
The same survey found that communication and collaboration difficulties had actually eased slightly: 15% named it a top struggle, down from 17% the year before. Taken together, these numbers suggest remote teams are not doomed to disconnection by default. Most remote workers report feeling connected, and the share struggling with collaboration, while real, was shrinking rather than growing.
Source: Buffer: State of Remote Work 2023
Listening
Sending a message is only half of communication. Whether it gets heard and understood is the other half.
19. Employees who often miss important messages are 52% less likely to be engaged
52% less likely to be engaged is how employees who say they "often" or "very often" miss important work communication compare with their peers, according to a 2022 Axios and Gallup communications study. The same group was 46% more likely to report stress and 30% less likely to describe themselves as thriving.
The same study found the flip side: employees who strongly agree they get enough information to do their job well are 2.9 times more likely to be engaged and have a burnout rate four times lower. This is a link between getting the information you need and how people feel about their jobs. It is not only about getting a message. It is about the message actually landing. Our active listening statistics look at listening skills specifically, including what helps people take in what they hear.
Source: Axios and Gallup: Communications Study
20. In 2015, Gallup found employees whose managers hold regular meetings with them were almost 3 times as likely to be engaged
Almost three times more likely to be engaged. That is how Gallup describes employees whose managers hold regular meetings with them, compared with employees whose managers do not. Gallup made this finding in an April 2015 article about what employees want from their managers.
Gallup's wider research has also found that managers account for at least 70% of the differences in employee engagement scores. A regular, recurring meeting is a simple structure that gives people a set time to talk with their manager. Gallup links consistent communication with higher engagement.
Source: Gallup: Employees Want a Lot More From Their Managers
Generations
Different generations of workers grew up with different defaults, and that still shows in how they communicate.
21. Millennial knowledge workers write more than knowledge workers overall, 64% versus 57%
64% of millennial knowledge workers say they communicate in writing most of the time, compared with 57% of knowledge workers overall, according to a 2022 survey by Grammarly and the Harris Poll. Millennials also leaned more toward video meetings, preferred by 48% of millennials versus 40% of knowledge workers overall.
Age did not change which channels existed, but it shifted which ones felt like the default. Millennials were also more likely to prefer text-based chat (36% versus 29% overall) and project or sales management software (22% versus 13% overall). Millennials also preferred email more often than knowledge workers overall, by 8 points. The survey did not break out Gen Z separately, so this is a millennial-versus-everyone comparison, not a full generational ranking.
Source: Grammarly and Harris Poll: The State of Business Communication
22. 30% of millennials say they thoroughly understand AI agents, versus 22% of Gen Z
30% of millennials say they thoroughly understand AI agents at work, compared with 22% of Gen Z, according to Slack's 2025 Workforce Index, a survey of 5,156 full-time desk workers in Australia, France, Germany, Japan, the UK and the US. Slack calls millennials the "surprise AI power user at work": 68% said they use AI for strategic work like drafting, summarizing and brainstorming ideas.
This runs against the common assumption that the youngest generation automatically leads on new technology. These are self-reported answers, so they show how well each group says it understands AI agents, not how well it really does.
Source: Salesforce: Slack Workforce Index 2025
AI in Workplace Communication
AI tools are now part of how people write, summarize and sit through meetings.
23. Just 7% of desk workers fully trust AI outputs for work tasks
7% is the share of desk workers who consider AI outputs completely trustworthy for work-related tasks, according to Slack's Workforce Index from June 2024, a survey of 10,045 desk workers in the US, Australia, France, Germany, Japan and the UK. Another 35% said AI results were only slightly or not at all trustworthy.
Trust and use are not the same thing, and this gap matters. People can use a tool regularly while still checking its output carefully, which is a reasonable response to a technology still new to most workplaces. The same survey found that desk workers who had real training in AI tools were far more likely to trust them than those without any training at all.
Source: Slack: Workforce Index, June 2024
24. In 2024, two-thirds of desk workers had never used AI at work
More than two-thirds of desk workers had never used AI at work as of Slack's June 2024 Workforce Index survey. Among the roughly one-third who had tried it, 81% said AI was improving their productivity.
That combination, low adoption but high satisfaction among adopters, is typical of a tool still early in its rollout. The survey also found that 37% of desk workers said their company had no AI policy, and desk workers at companies that had set rules for AI use were nearly 6 times as likely to have tried it. Only 15% of desk workers worldwide strongly agreed they had the training they needed to use AI effectively. Adoption and trust both tend to rise once training and clear rules catch up with the technology itself.
Source: Slack: Workforce Index, June 2024
25. In a Microsoft study, people with access to Copilot read 6 fewer emails a week than people without it
6 fewer emails a week is what people with access to Microsoft 365 Copilot read, compared with people without it, across the full sample in a Microsoft WorkLab study of 6,317 employees published in September 2024. Employees with the highest Copilot usage read 18 fewer emails a week, three times the average drop.
The same study found a law firm where Copilot users increased document creation by 58%, and a financial services company where employees with access to Copilot co-edited 33% more documents with colleagues than those without it did. In this study, Copilot went along with less time reading email and in meetings, and also with more document creation and co-editing at some firms.
Source: Microsoft WorkLab: AI Data Drop, 3 Key Insights From Real World Research on AI Usage
What Workplace Communication Statistics Reveal
Three patterns run through these numbers. First, volume is high and still rising: Microsoft says Teams messages per person rose 6% in a year. Between emails, Teams messages, chat and meetings, the average Microsoft 365 user faces hundreds of incoming items a day, and business leaders spend even more hours communicating. Second, the cost is not spread evenly. Business leaders estimate that their teams lose 7.47 hours a week to poor communication, and leaders were also more likely than knowledge workers to report written miscommunication every week (79% versus 54%), so the pain shows up differently depending on your role.
Third, one fix people say they want is simple: 70% of employees prefer shorter digital messages. In Grammarly's survey, 63% of knowledge workers and 88% of business leaders also said they wish their company had better tools to help people communicate. Regular talks with a manager are linked to higher engagement, and AI tools are starting to take on some of the summarizing and note-taking work in meetings.
Where this is heading looks less like one channel winning and more like better triage. These numbers do not show what organizations with lower communication costs do differently, but employees say they want shorter messages and faster ways to tell which ones matter.
Poor communication costs time, and the numbers above suggest much of it goes to reading, hearing and keeping track of messages.
Your Conversations, Captured and Summarized
With this much email, chat and meeting volume, the conversations that matter most, an important meeting, a one-on-one, an interview, are easy to lose track of once they end. Notes get rushed or skipped entirely, and action items live only in someone's memory.
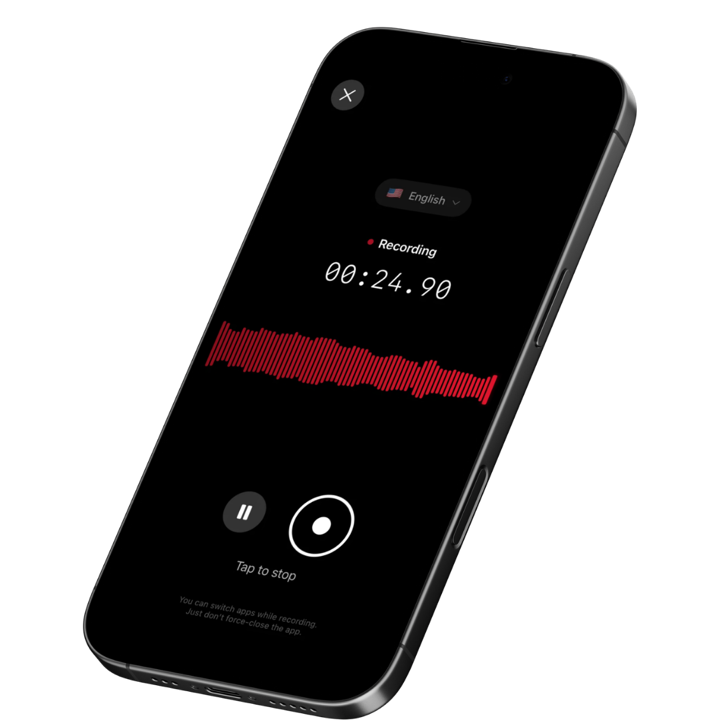
Speakwise records in-person conversations, meetings, lectures and interviews with one tap, right from your iPhone. It transcribes what was said, with speaker identification so the transcript shows who said what, and writes an AI summary with key points and action items. (Speaker identification is not included in every plan. When you start your free trial, pick the plan that includes it.) You can then export the summary and transcript as a PDF or share a link, so everyone who was in the conversation can read back what was decided, instead of relying on whoever happened to take notes.
Speakwise works in 100+ languages with automatic detection, records up to 5 hours in a single session, and keeps recording even if you lose signal, transcribing once you are back online. Accuracy reaches 95%+ in optimal audio conditions and 92%+ in noisy rooms with several speakers.
Try Speakwise free for 7 days ($0.00). After that, it starts at $69.99 per year, which is about $5.83 a month, billed yearly. Prices shown are for the US and can differ by country.Download Speakwise from the App Store and turn your next meeting or conversation into a transcript, AI summary and action items you can read back later.
Try Speakwise free for 7 days
Available on the App Store | iOS Optimized

🎯 4.9★ App Store Rating | 📱 Built for iOS
